Tables and illustrations are important tools for efficiently communicating information and data contained in your research paper to the readers. They present complex results in a comprehensible and organized manner.
However, it is advisable to use tables and illustrations wisely so as to maximize the impact of your research.They should be organized in an easy-to-understand format to convey the information and findings collected in your research. The tabular information helps the reader identify the theme of the study more readily. Although data tables should be complete,they should not be too complex. Instead of including a large volume of data in a single unwieldy table, it is prudent to use small tables to help readers identify the important information easily.

For the reader, a research paper that is dense and text-heavy can be tiresome. Conversely, tables not only encapsulate your data lucidly, but also welcome a visual relief for the reader. They add value to the layout of your paper. Besides, and more importantly, reviewers often glance at your tabulated data and illustrations first before delving into the text. Therefore, tables can be the initial draw for a reviewer and deliver a positive impact about your research paper. If you can achieve an optimum balance among your text, tables, and illustrations, it can go a long way toward being published.
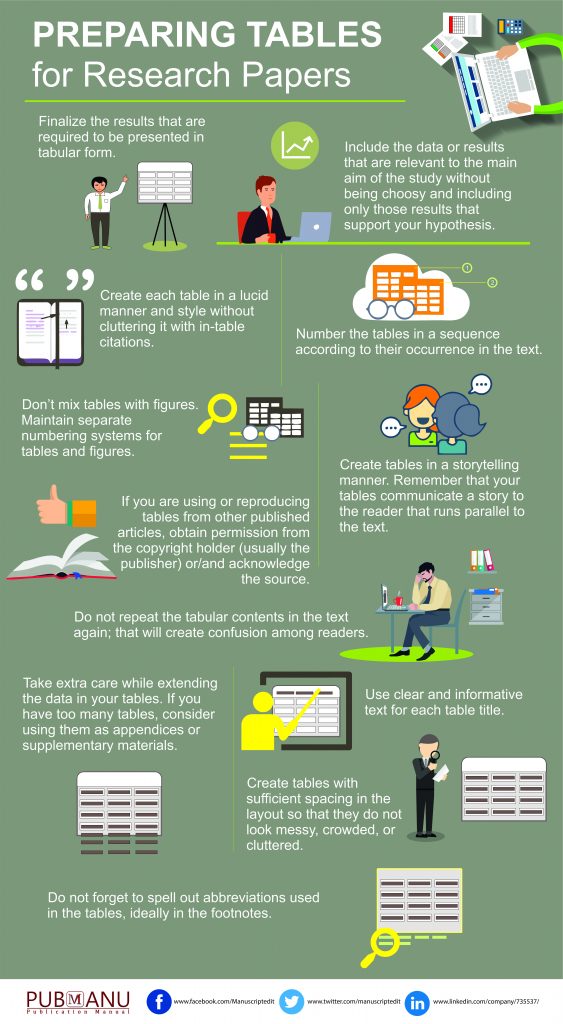
Here are some points you should consider before drafting the tables in your research paper:

